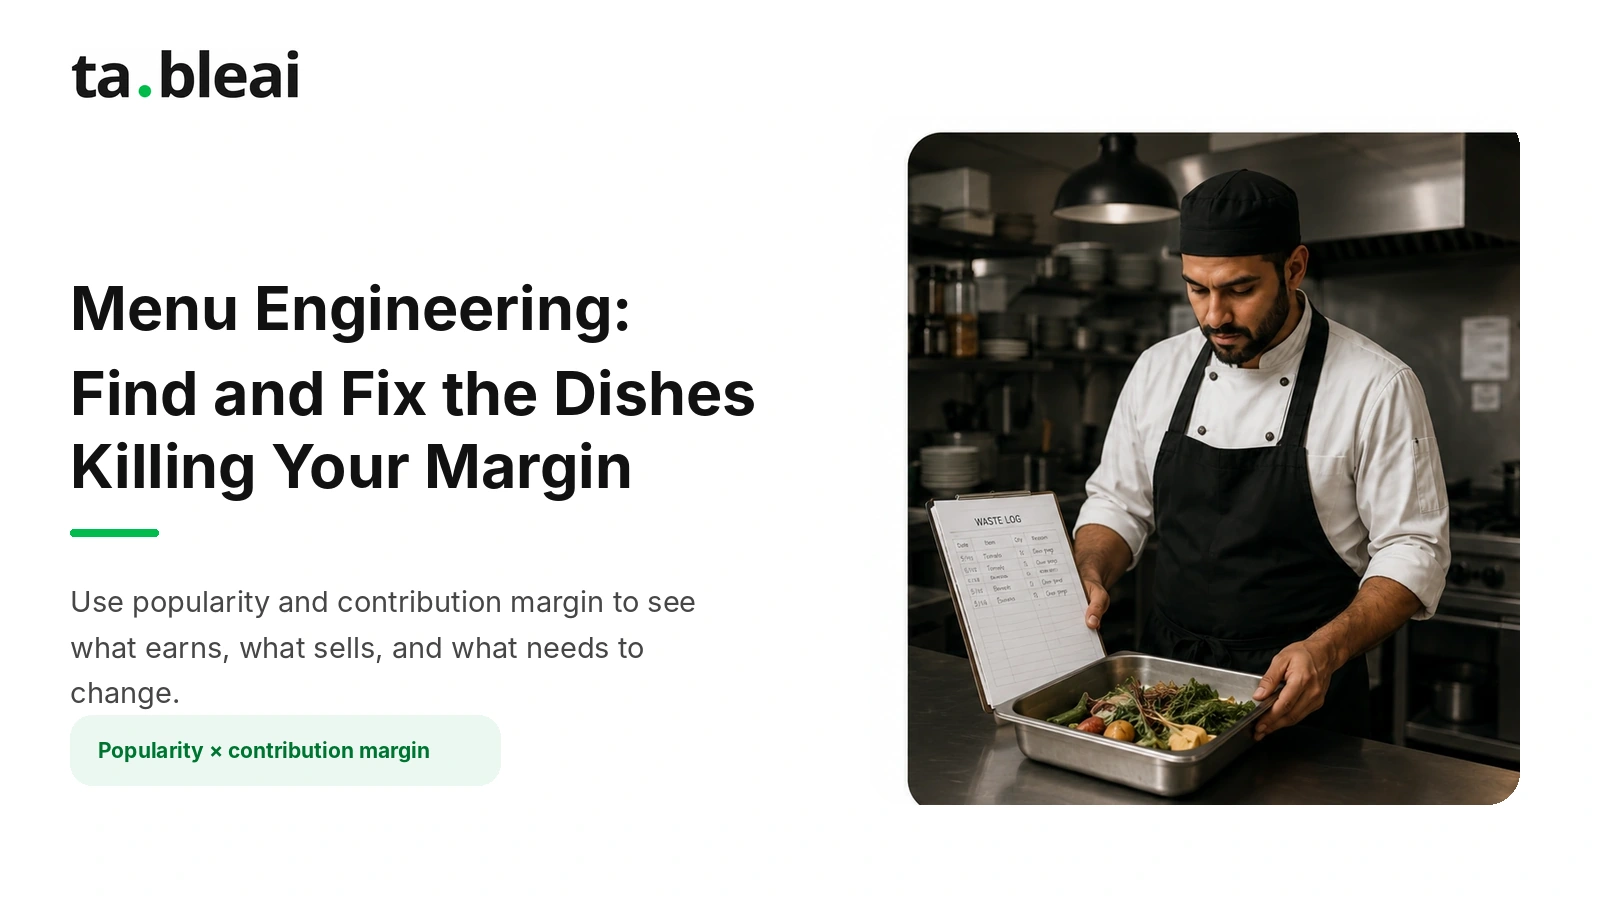
Menu engineering is how you stop guessing which dishes make you money and start knowing. Most owners can name their best seller in a second. Ask them which dish earns the most actual profit per plate, and the room goes quiet. Those are often two different dishes, and the gap between them is where your margin leaks out.
Here is the short version. Menu engineering classifies every dish by two things: how often it sells (popularity) and how much cash profit it puts in the till per plate (contribution margin). Plot those two against each other and every dish lands in one of four boxes: stars, plowhorses, puzzles, or dogs. Each box gets a different action. Do that across the whole menu and you can lift profit without buying anything, hiring anyone, or selling a single extra plate.
What menu engineering actually measures
Two numbers. That is the whole thing.
Popularity is just how many of each dish you sell in a set period, a straight count of units. A month is a good window for most independents.
Contribution margin is the money left over from one plate after you pay for its ingredients. Measure it in dollars, not as a percentage.
Contribution Margin = Menu Price − Food Cost of the Dish
A burger priced at $12 with $4 of ingredients has a contribution margin of $8. A pasta priced at $16 with $3.50 of ingredients has a margin of $12.50. The pasta wins on cash per plate even though the burger looks cheaper to make.
This is the part people get wrong. Food cost percentage is useful (there is a full breakdown in the restaurant food cost calculator guide), but percentage alone will lie to you here. A dish with a scary 40% food cost can still be your most profitable plate if it sells for enough and moves in volume. Menu engineering ranks by dollars per plate, then weighs that against how often the dish sells. Both numbers, together.
The menu engineering matrix: stars, plowhorses, puzzles, dogs
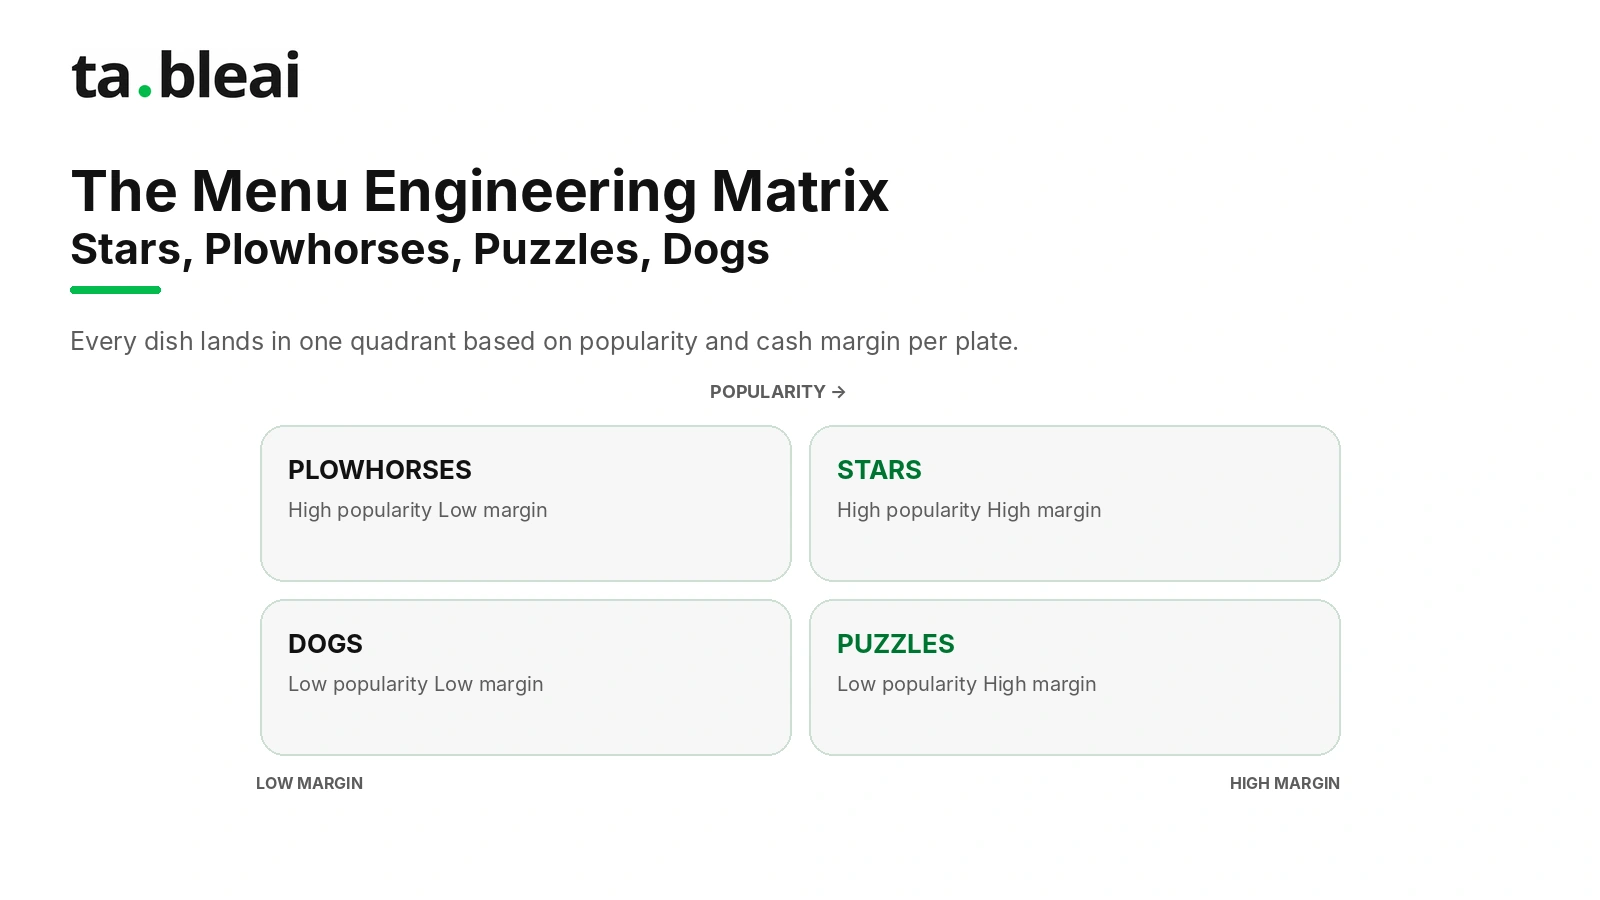
Draw a simple grid. Popularity on one axis, contribution margin on the other. Split each axis at the average for your menu. You get four quadrants.
- Stars — high popularity, high margin. Sell a lot, earn a lot per plate. Your best assets.
- Plowhorses — high popularity, low margin. Everyone orders them, but they barely earn. Workhorses that pull the cart cheaply.
- Puzzles — low popularity, high margin. Great money per plate, but nobody orders them. Hidden potential.
- Dogs — low popularity, low margin. Few orders, little profit. Dead weight on the menu.
Every dish belongs somewhere. The point of the exercise is not the labels. It is the four different playbooks that follow.
How to pull the data
You need three inputs per dish: how many you sold, what it costs to make, and what you charge.
1. Sales count per item. For a set period, usually a month. If you run a POS, export the item sales report. If you don't, you count. Every dish, every day, tallied. This is the input most owners skip because it feels like a chore, which is exactly why they never know their real sales mix.
2. Food cost per dish. Cost out the recipe. Every ingredient, its portion, its unit price, added up per plate. Tedious the first time, quick after that. Prices drift, so refresh this at least quarterly.
3. Menu price. You already know this one.
With those three you can build the matrix. Sales count gives popularity. Price minus food cost gives contribution margin. Average both across the menu, and each dish falls into a quadrant.
Counting plates by hand every day is where this falls apart for busy owners. That is the boring habit menu engineering depends on. If you'd rather not run a full POS just to capture a sales count, you can text your daily numbers into a tracker like TableAI and let it total the month for you. Same data, five seconds a day instead of a spreadsheet on Sunday night. It works the same way for a small kitchen or a café with a tight menu.
A worked mini-example
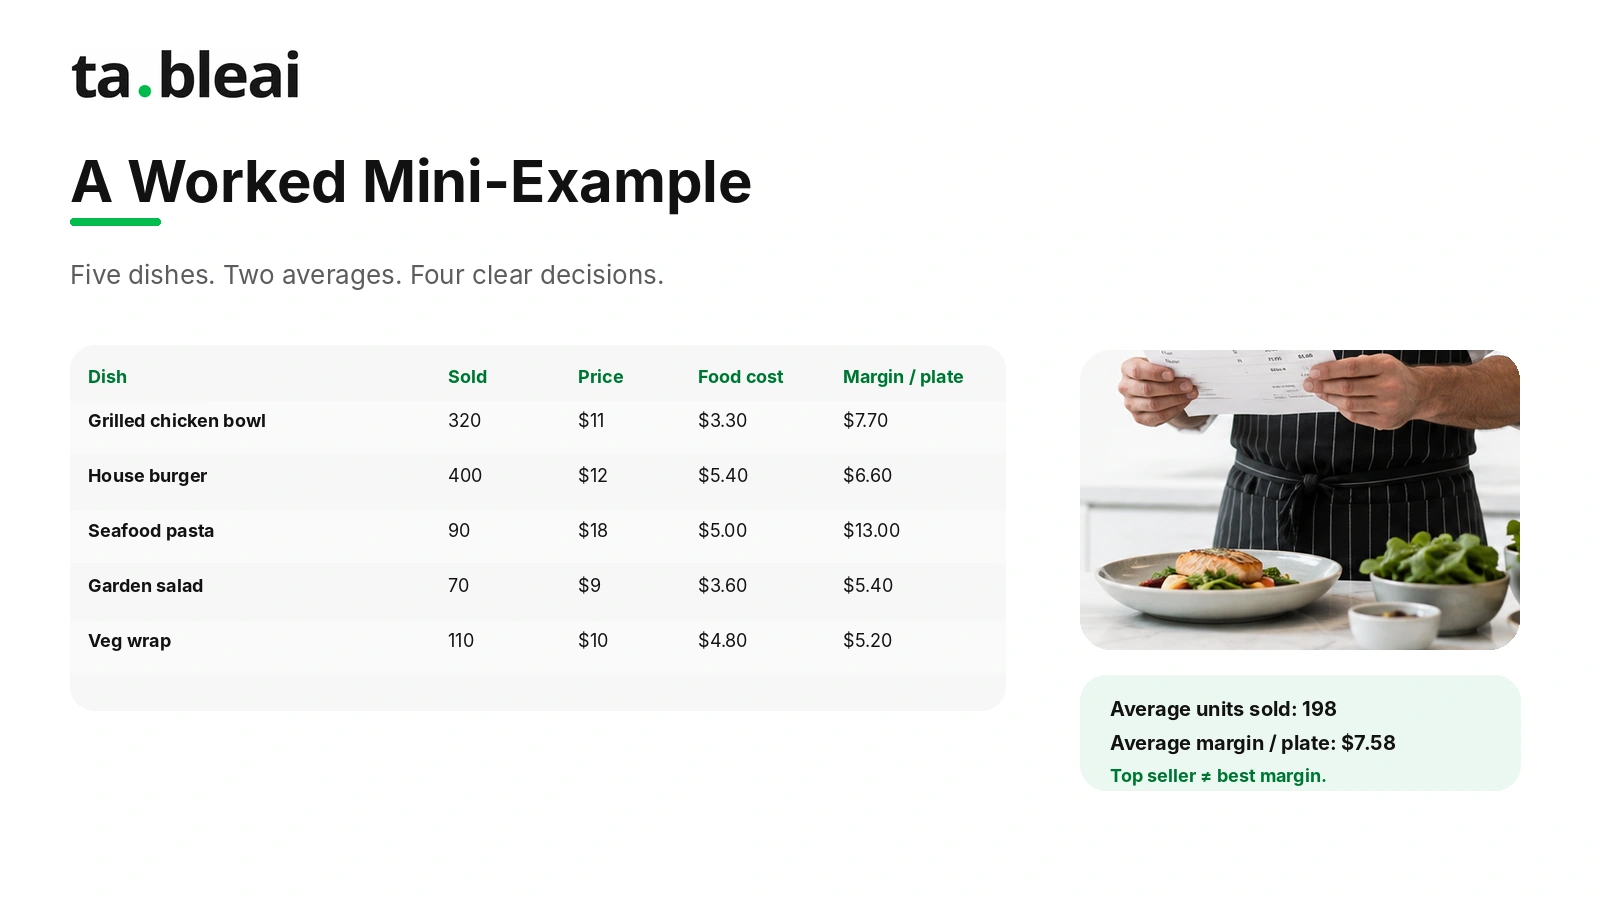
Say you run a small kitchen with five dishes. Here is one month.
| Dish | Sold | Price | Food cost | Margin/plate | Total margin |
|---|---|---|---|---|---|
| Grilled chicken bowl | 320 | $11 | $3.30 | $7.70 | $2,464 |
| House burger | 400 | $12 | $5.40 | $6.60 | $2,640 |
| Seafood pasta | 90 | $18 | $5.00 | $13.00 | $1,170 |
| Garden salad | 70 | $9 | $3.60 | $5.40 | $378 |
| Veg wrap | 110 | $10 | $4.80 | $5.20 | $572 |
Now find the two averages.
Average units sold = (320 + 400 + 90 + 70 + 110) ÷ 5 = 198 plates
Average margin/plate = (7.70 + 6.60 + 13.00 + 5.40 + 5.20) ÷ 5 = $7.58
Sort each dish against those two lines:
- Grilled chicken bowl — 320 sold (above 198), $7.70 margin (above $7.58). Star.
- House burger — 400 sold (above 198), $6.60 margin (below $7.58). Plowhorse.
- Seafood pasta — 90 sold (below 198), $13.00 margin (above $7.58). Puzzle.
- Garden salad — 70 sold (below 198), $5.40 margin (below $7.58). Dog.
- Veg wrap — 110 sold (below 198), $5.20 margin (below $7.58). Dog (borderline, low on both).
The burger is the top seller and the owner's pride. It is also a plowhorse. It sells the most and earns the least per plate. Meanwhile the seafood pasta earns nearly double per plate but almost nobody orders it. That is the whole story of most menus in one table: the popular dish isn't the profitable one, and the profitable dish is hiding.
What to do with each quadrant
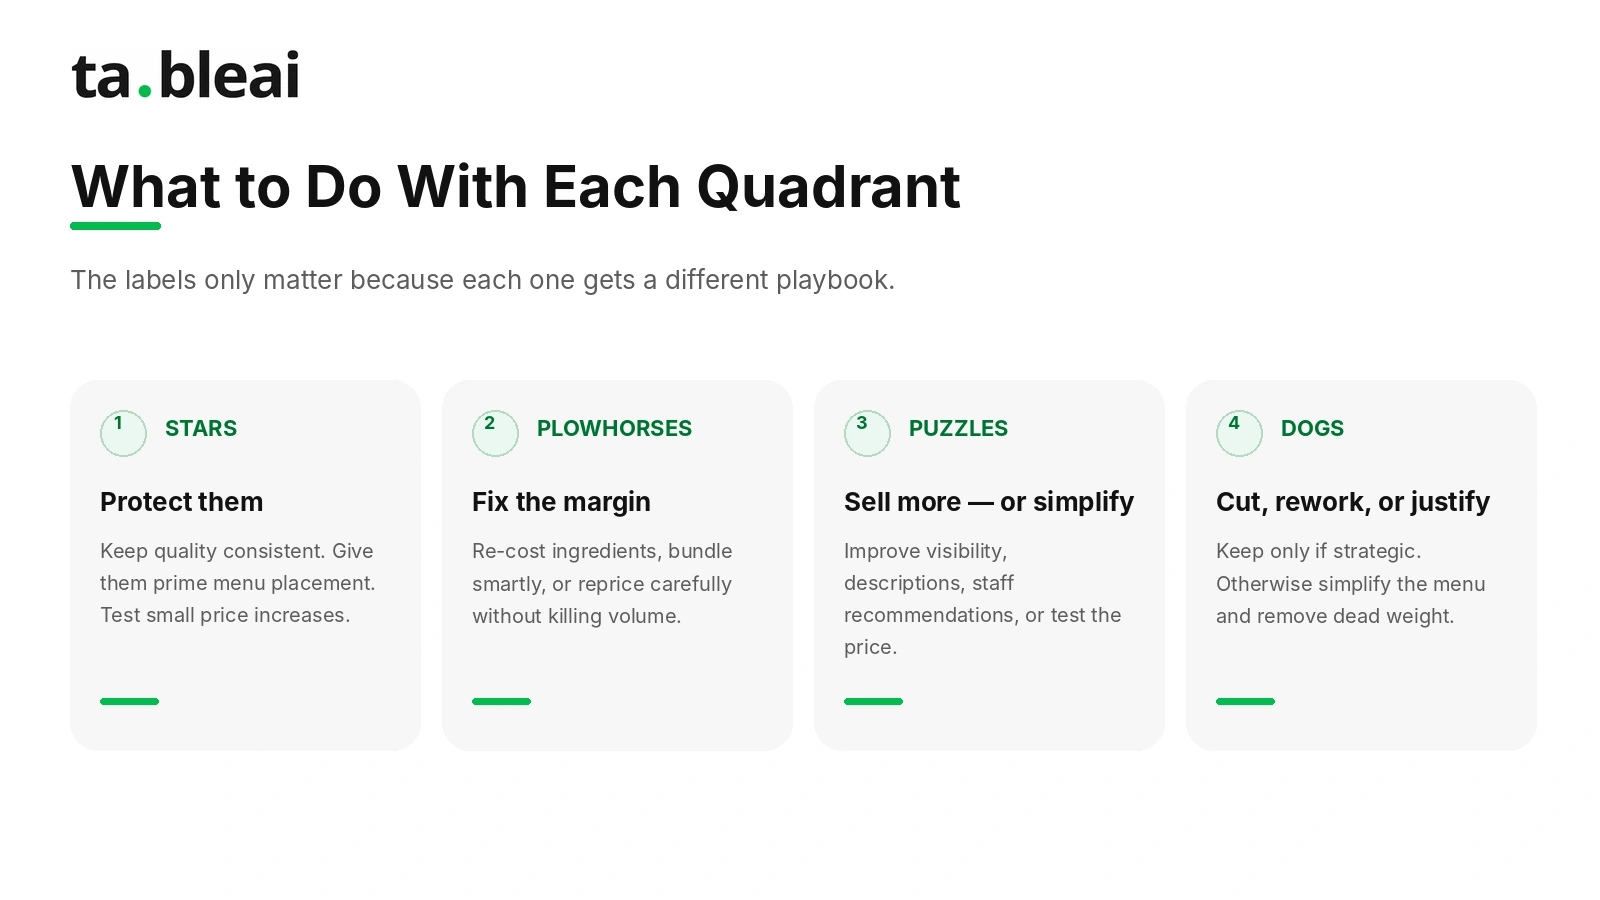
Stars: protect them, don't touch the recipe
Your grilled chicken bowl is carrying the menu. Rule one is do not mess it up. Keep the portion consistent, keep the quality where it is, keep it available.
What you can do is give it more airtime. Put it in the prime real estate on the menu (top-right of a page, or first in its section, where eyes land). Feature it. Make it the dish a new customer is most likely to try first. Small price tests are fine here too, a $0.50 bump on a dish selling 320 plates is $160 a month, and a star has enough goodwill to absorb it. Test, watch the count, revert if volume drops.
Plowhorses: fix the margin without scaring off the crowd
The house burger sells 400 a month at $6.60 profit each. If you can lift that margin by even a dollar without losing volume, that is $400 a month from one dish.
Options, roughly in order of least risk:
- Re-cost it. A $5.40 food cost on a $12 burger is high. Can you source the patty cheaper, trim the portion of the expensive garnish, or swap one costly ingredient? Shaving $0.80 off food cost is a straight $0.80 onto margin, and the customer never notices.
- Bundle it. Pair the burger with a high-margin side or drink as a combo. The combo price nudges the whole ticket up while feeling like a deal.
- Reprice carefully. A popular dish can sometimes take a small increase. Move $12 to $12.75. On 400 plates that is $300 a month if volume holds. Watch the count for two weeks.
The trap with plowhorses is over-correcting. Raise the price too hard and you convert your traffic driver into a puzzle, so keep the moves small and measured.
Puzzles: sell more of them or simplify them
The seafood pasta earns $13 a plate and sells 90 a month. If you could get it to 150 plates, that is another $780 in monthly profit from a dish you already make.
Puzzles usually have a visibility problem or a friction problem, not a quality problem. Try:
- Reposition it on the menu. Move it out of the corner. Add a short, appetizing description. Photos help if your menu uses them.
- Train the staff to suggest it. A server recommending the pasta shifts orders faster than anything printed.
- Make it easier to say yes to. Sometimes the price is a wall. If $18 is scaring people off, test $16 and see if volume more than makes up the $2. A puzzle at higher volume can beat a puzzle at higher price.
If a puzzle stays a puzzle after real effort, it may just be a dish your customers don't want. Which moves it toward the dog conversation.
Dogs: cut, rework, or let them earn their keep
The garden salad and veg wrap earn little and sell little. Dogs are usually the answer to "why is my kitchen carrying 30 ingredients?"
Before you cut, ask three questions:
- Does it use ingredients other dishes need anyway? If the salad shares everything with your star bowl, it costs almost nothing to keep on the menu and adds variety. Leave it.
- Is it there for a reason beyond profit? A vegetarian option or a kids' item can be a strategic keep even as a dog, because losing it might cost you the whole table.
- Can it be reworked into a puzzle? Sometimes a dog is a decent-margin dish with a bad name or a boring description. Fix the presentation before you kill it.
If none of those hold, cut it. Every dog you remove is fewer ingredients to stock, less prep, less waste, and a shorter menu that pushes customers toward your stars. A tighter menu often lifts profit on its own.
Where this connects to the rest of your numbers
Menu engineering works on one input to your prime cost: the food side of it. It tells you which dishes to promote, reprice, or cut. It does not touch labor, rent, or the other lines that decide whether the whole place makes money. For the bigger frame, see how food and labor combine in the restaurant prime cost guide, and if your gut says something is off but you can't name it, the warning signs in how to tell if your restaurant is losing money pair well with a menu audit.
The habit that makes all of this possible is capturing the sales count and ingredient costs consistently. That is the same daily tracking that catches portion drift and supplier price hikes early. If you want that without a full POS, TableAI's flat monthly pricing covers daily sales tracking, ingredient inventory, and low-stock alerts over WhatsApp, so the data you need for your next menu engineering pass is already sitting there.
Frequently asked questions
What is menu engineering?
Menu engineering is the practice of analyzing every dish by two numbers, how often it sells and how much profit it makes, then classifying each into one of four groups and taking a specific action to raise overall profit. It treats your menu as a set of financial decisions, not just a food list.
What are the four categories in menu engineering?
The four categories are stars (high popularity, high profit), plowhorses (high popularity, low profit), puzzles (low popularity, high profit), and dogs (low popularity, low profit). Each category gets a different fix, from protecting stars to cutting dogs.
How do you calculate contribution margin for a dish?
Contribution margin is the menu price minus the food cost of the dish. If a burger sells for 12 dollars and costs 4 dollars in ingredients, its contribution margin is 8 dollars. Menu engineering ranks dishes by this dollar figure, not by food cost percentage.
How often should you do a menu engineering analysis?
Most independent restaurants should run a full menu engineering analysis every quarter, and re-check it after any big supplier price change or menu update. Sales mix and ingredient costs both drift over months, so a once-a-year look misses the damage.
Does menu engineering mean I should raise all my prices?
No, menu engineering rarely points to a flat price increase. It usually points to targeted moves like repricing one plowhorse, re-costing a puzzle, moving a star to a better spot on the menu, and cutting a dog, so the changes are small but the profit gain is real.
Related reading: