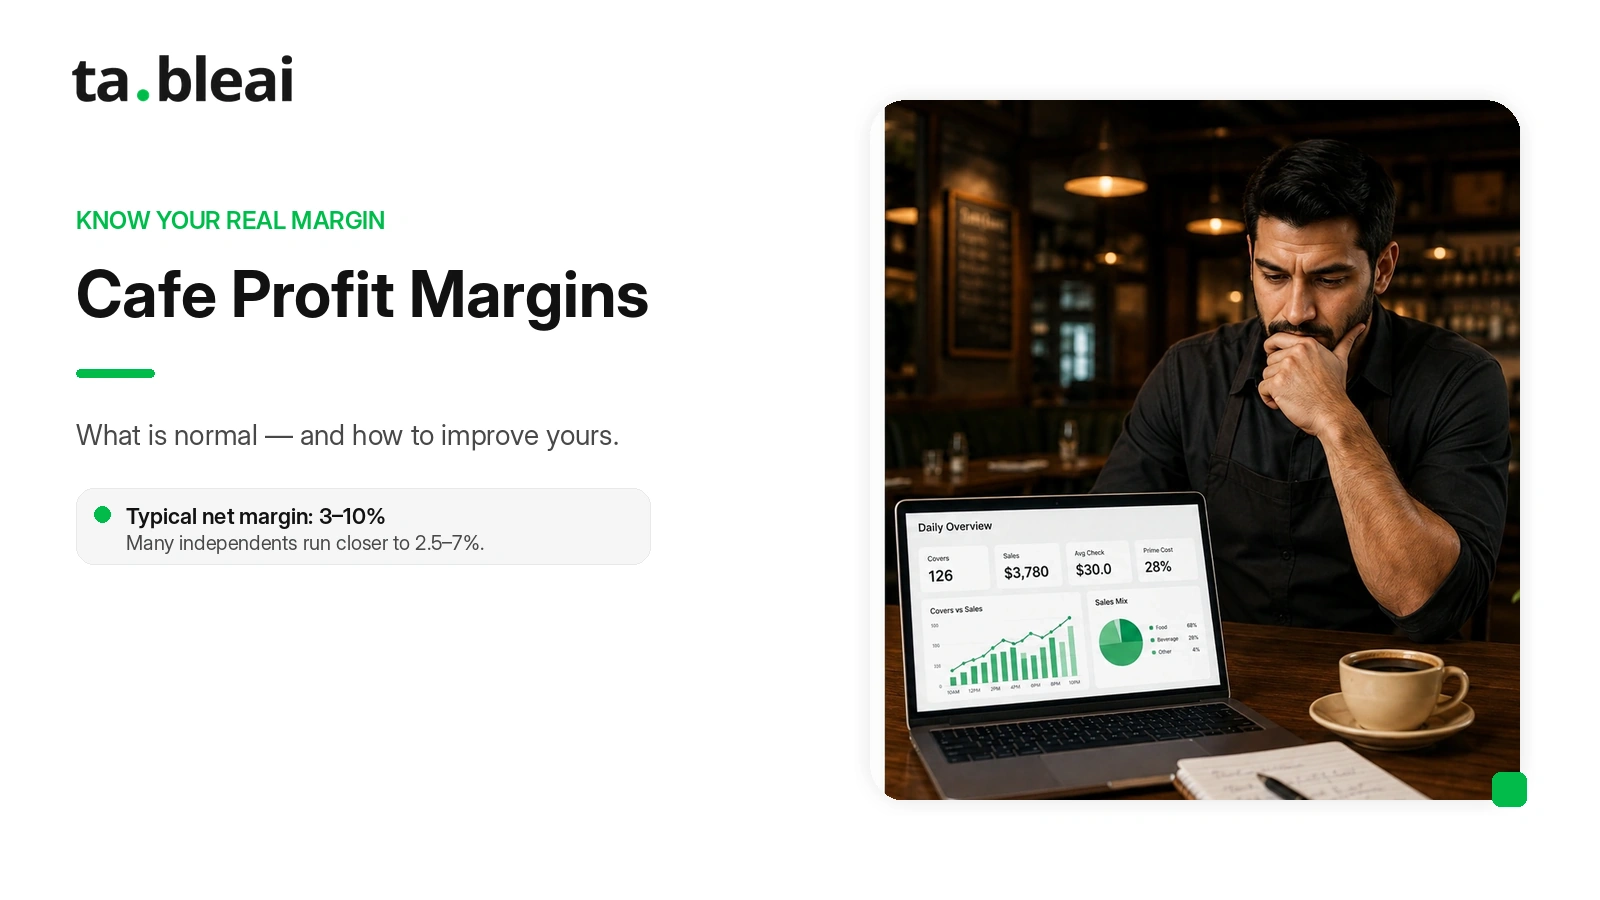
If you run a small cafe and want the short answer: a typical cafe nets 3-10% profit after all costs are paid, and runs a gross margin of 60-70% (what's left after ingredient costs alone). Many independent cafes sit closer to 2.5-7%, thin or breaking even, and only well-run or takeaway-led shops reliably clear 10%. Below about 3%, you're vulnerable to a single bad month.
Those are commonly reported ranges, not promises. Your actual numbers depend heavily on rent, labor, and how much of your revenue comes from coffee versus food. This guide breaks down what's normal, why coffee is so much more profitable than food, and the concrete levers that actually move the number.
Typical cafe profit margins at a glance
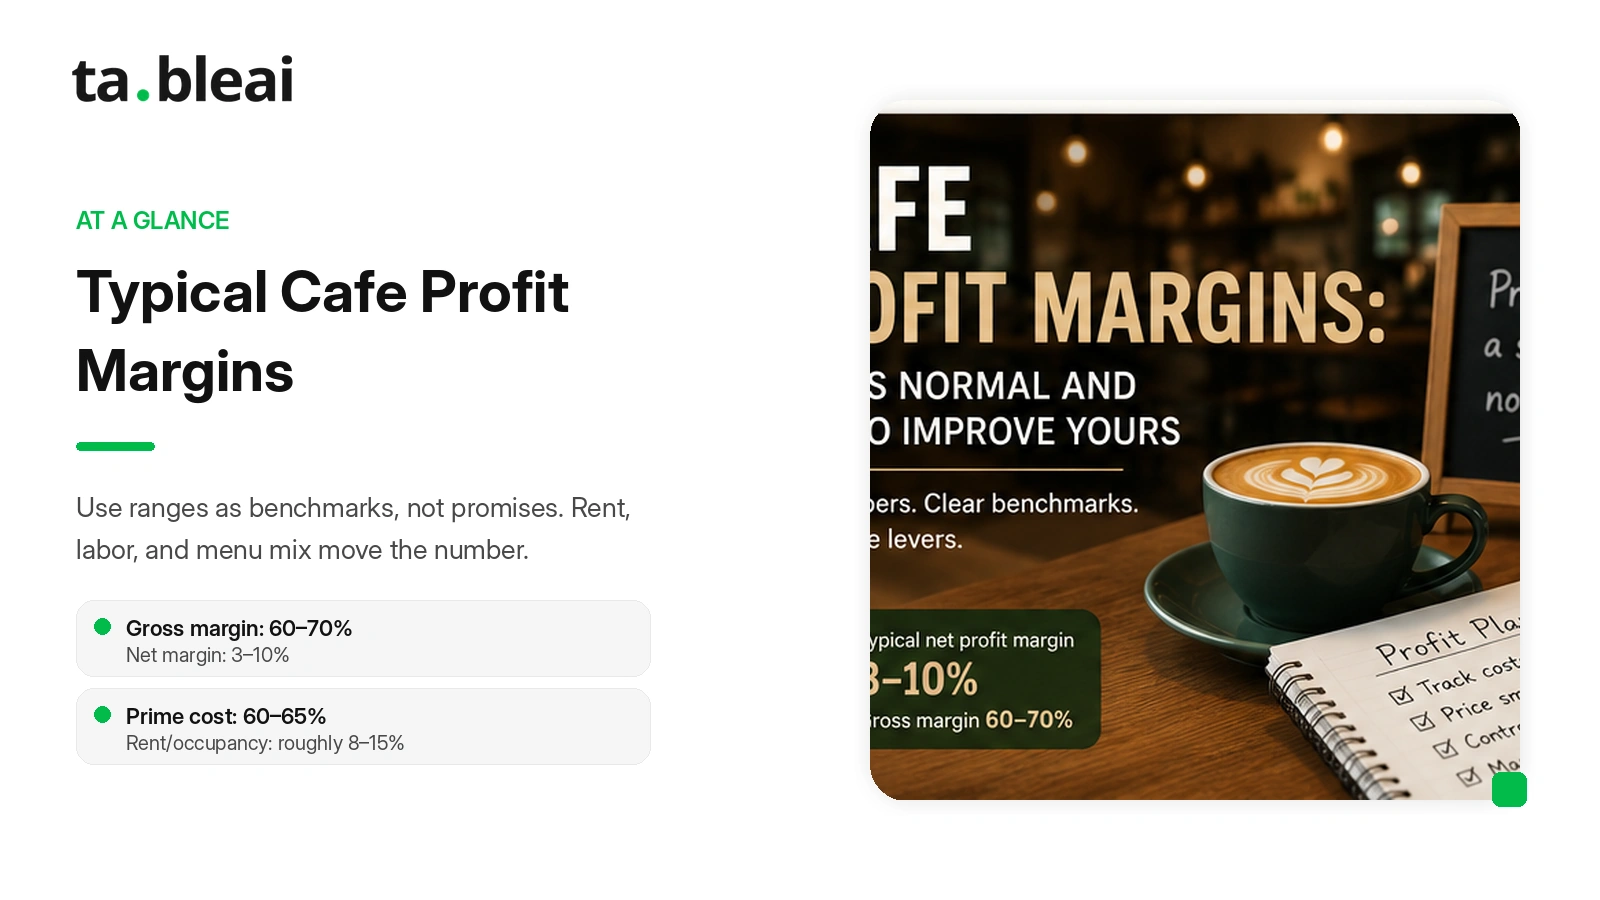
Here are the ranges that show up most often across industry sources. Treat them as benchmarks to compare against, not targets carved in stone.
| Metric | Typical range | What it means |
|---|---|---|
| Gross profit margin | 60-70% | Revenue minus the cost of ingredients (coffee, milk, food) |
| Net profit margin | 3-10% | What's left after all costs; many independents run 2.5-7% |
| Coffee/drinks gross margin | 70-80%+ | Very cheap to make relative to price |
| Food gross margin | 55-65% | Higher ingredient cost, more waste; hot food can drop below 55% |
| Prime cost (labor + COGS) | 60-65% target | Drifting toward 70% means margin is squeezed |
| Rent/occupancy | 8-15% of revenue | Lower is better; location-dependent |
A quick reality check on what net margin means in dollars: on $300,000 in annual revenue, an 8% net margin is about $24,000 in profit for the year. That's why a couple of percentage points matter so much — moving from 6% to 9% on that same revenue is roughly $9,000 more in your pocket, without selling a single extra cup.
New cafes usually sit at the low end (or run at a loss) for the first year or two. Mature, well-run independents drift toward the higher end. Format matters too: takeaway- and drive-thru-heavy cafes tend to net more than full-service, sit-down cafes because they carry less labor and less seating cost per dollar of sales.
Why coffee has great margins but food usually doesn't
This is the single most important thing to understand about cafe profitability.
A latte might cost you well under a dollar in coffee, milk, and a cup — and sell for several dollars. That's a gross margin north of 70-80%. Coffee is, pound for pound, one of the best-margin products in all of food service.
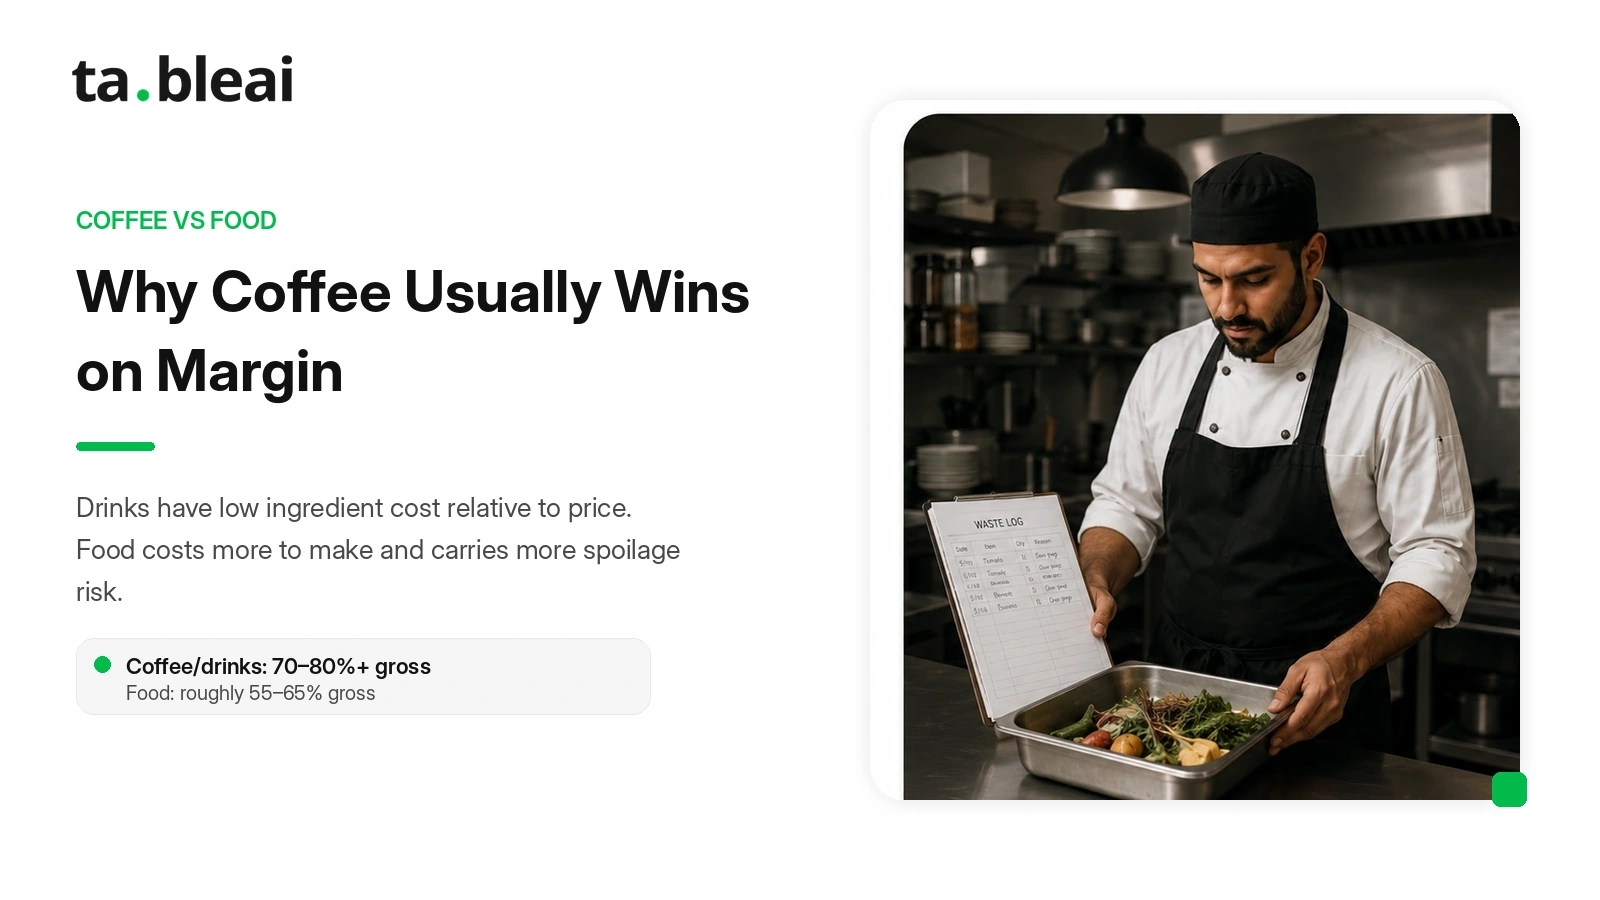
Food is a different story. It costs more to make, takes more labor to prep, and this is the killer, it spoils. A tray of pastries that doesn't sell by close is money in the bin. Sandwiches, salads, and hot food all carry higher ingredient costs and more waste risk, so cafe food gross margins usually land closer to 55-65%. Once sandwiches and hot food dominate the counter, blended food margin can slip below 55%.
The practical takeaway: a coffee-led menu is more profitable per dollar of sales than a food-led one. That doesn't mean drop food — food often raises the average ticket and brings people in at lunch. But you should know which side of the menu is actually earning, and price and portion accordingly. If food is dragging your blended margin down, that's a signal to fix waste and pricing on food specifically, not to assume the whole cafe is unprofitable.
The levers that actually improve cafe margins
There's no single switch. Net margin improves when you make small, consistent gains across four levers. Here they are, roughly in order of impact.
1. Pricing
The fastest lever, and the one owners are most afraid to pull. A modest price rise on high-volume drinks flows almost entirely to the bottom line, because your costs barely move. Raising a $4.00 flat white to $4.30 on 100 cups a day is roughly $30 a day, or around $10,000 a year — and most regulars won't blink at 30 cents.
The mistake is raising prices across the board and hoping. Instead, raise on your highest-volume, lowest-cost items (the drinks) and hold or bundle on price-sensitive ones. Price so that COGS lands around 25-35% of sales, and review pricing at least once a year against your actual ingredient costs, because supplier prices creep up quietly.
2. Food cost (COGS)
Your cost of goods is the percentage of revenue you spend on ingredients, and a healthy cafe usually keeps COGS around 25-35% of sales. If it's climbing past that, your margin is shrinking whether you notice or not. The two hidden culprits are portioning (over-pouring milk, heavy-handed plating) and waste (spoilage, over-prep, comps).
You can't fix what you don't measure. Knowing you got 20kg of coffee this week and sold roughly what you should have, versus quietly losing 15% to waste, is the difference between a 62% and a 68% food cost. For the full method, see our restaurant food cost calculator guide, which walks through calculating and controlling COGS step by step.
3. Labor
Labor is usually your largest single cost after ingredients, and the most controllable in real time. As a target, aim to keep labor around 25-35% of sales. The problem is almost always scheduling: two extra staff on a dead Tuesday afternoon, or being caught short on a busy Saturday and comping unhappy customers.
Match your roster to actual demand, not habit. That requires knowing your sales patterns by day and by hour — which most cafes track only loosely, from memory. Even trimming one over-scheduled shift a week adds up over a year.
4. Product mix
Every menu has heroes and drags. Specialty coffee, a signature drink, an add-on shot — these are high-margin. Nudge customers toward them with placement, staff suggestion, and simple bundles. Shifting even 10% of sales from low-margin food to high-margin drinks lifts your blended margin without adding a single customer.
Labor + food cost = your prime cost
If you only track one number, track prime cost: labor plus cost of goods, combined, as a percentage of revenue. Aim to hold it around 60-65%, with labor near 25-35% of sales and COGS near 25-35%. When it drifts toward or above 70%, your margin is already squeezed. Everything else (rent, utilities, insurance) is largely fixed, so prime cost is where the fight is won or lost.
Prime cost is the single best early-warning number for whether your cafe is healthy. We cover exactly how to calculate and manage it in our guide to restaurant prime cost — worth reading right after this one if you want the operational detail.
You can't improve a margin you can't see
Here's the honest problem underneath all of this: most small cafe owners don't know their real numbers day to day. They know roughly what they sold. They don't know precisely how much coffee they went through, how waste is trending, or whether last Tuesday's labor was too heavy — until the accountant tells them months later, when it's too late to change anything.
That's the gap tracking closes. If you record daily sales, ingredient usage, and low-stock alerts consistently, the levers above stop being guesswork. You can see food cost creeping, catch the over-staffed shift, and price against real costs.
This is what TableAI's tracking tool for cafes does, and deliberately nothing more. It's a WhatsApp-based tracking tool, not a POS — it doesn't process cards or print receipts, and you keep your existing payment setup. You text things like "sold 180 coffees today" or "got 12kg beans" and it logs them. Every morning at 7am it sends a briefing: yesterday's sales, what's running low, what to expect. It covers daily sales tracking, ingredient inventory with low-stock alerts, staff attendance, and supplier phone numbers.
Where it's not the fit: if you want automatic sales capture, integrated card processing, or detailed accounting, you want a full POS instead — TableAI won't replace that. It's for owners who'd rather text a number than tap through an app, and who mainly need to see their numbers to act on them. It runs a flat ~$29-49/month and is free during early access. You can compare on the pricing page.
Frequently asked questions
What is a good profit margin for a cafe?
A net profit margin of 3-10% is commonly considered healthy for a small cafe, though many independents run closer to 2.5-7% and only well-run or takeaway-led shops clear 10%. Gross margin (revenue minus the cost of ingredients) typically runs 60-70%. These are reported ranges, not guarantees, and vary a lot with rent, labor, and how much food you sell versus drinks.
How much profit does a cafe make?
A small independent cafe commonly nets somewhere between 3% and 10% of revenue after all costs are paid. Many independents sit thinner still, closer to 2.5-7% or breaking even, especially in the first year or two. On $300,000 of annual revenue, an 8% net margin is roughly $24,000 in profit. Drive-thru or takeaway-heavy cafes tend to sit at the higher end because they carry less labor and seating cost.
Why does coffee have a high margin but food does not?
Coffee has a very low ingredient cost relative to its selling price, so a latte can carry a gross margin above 70-80%. Food is more expensive to make and spoils faster, so cafe food gross margins usually land closer to 55-65%. Sandwiches and hot food can pull blended food margin below 55%. This is why a coffee-led menu is generally more profitable per dollar of sales than a food-led one.
What is the biggest cost that lowers cafe profit?
For most cafes the two largest costs are labor and cost of goods (ingredients), which together make up your prime cost. Aim to keep prime cost around 60-65% of revenue, with labor near 25-35% and COGS near 25-35%. When it drifts toward or above 70%, net profit is already squeezed, so labor and food cost are the two levers with the most impact.
How can I improve my cafe's profit margin?
The highest-impact moves are usually raising prices modestly on high-volume drinks, tightening food cost by tracking waste and portioning, scheduling labor to match real demand, and shifting your product mix toward high-margin items like specialty coffee. Small consistent gains across all four typically move net margin more than any single big change.
The bottom line
A typical small cafe nets 3-10% and runs a 60-70% gross margin, with coffee carrying the profit and food often dragging it. Many independents sit closer to 2.5-7%. You improve the number by pulling four levers together, pricing, food cost, labor, and product mix, and by watching prime cost as your health check.
None of it works if you're flying blind. Whatever tool you use, the habit of seeing your daily numbers is what turns these benchmarks from a blog post into a bigger number at the end of the year.