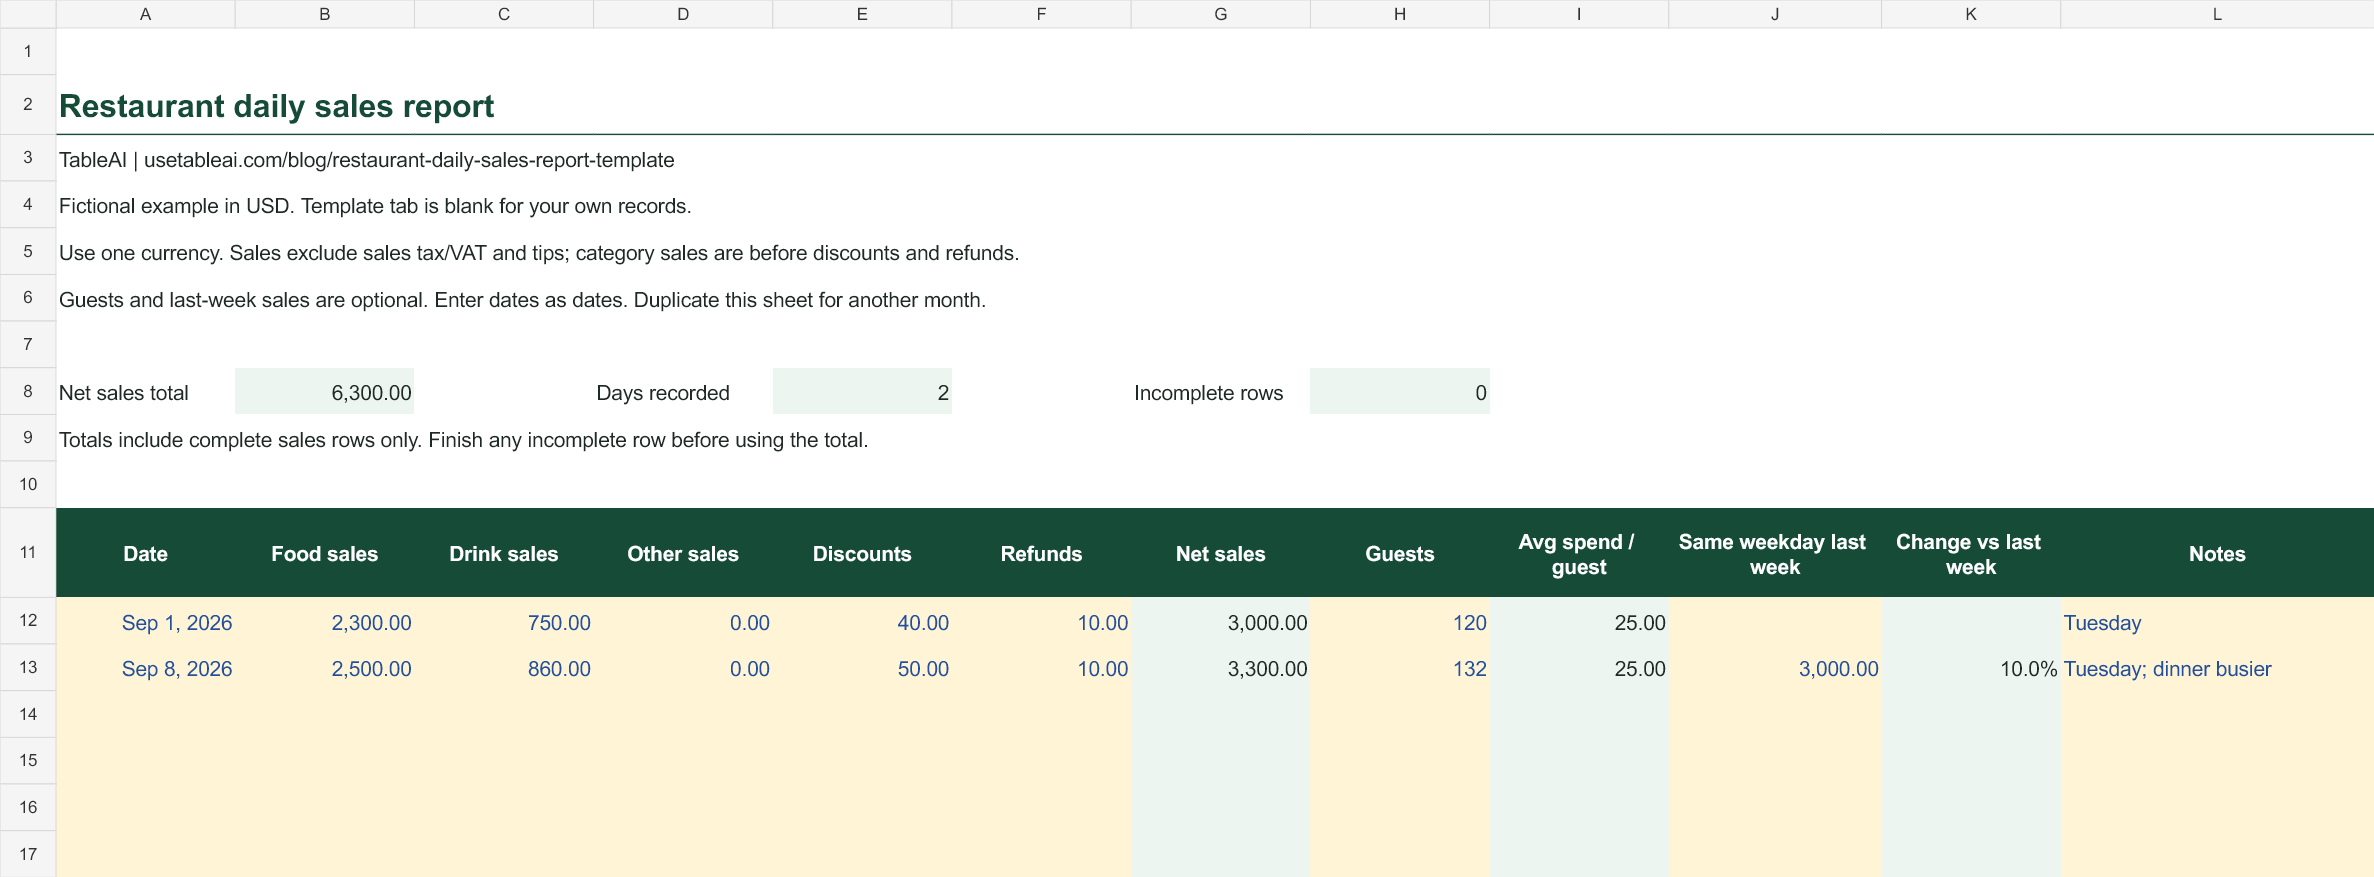
A daily sales report should answer three questions before you open tomorrow: what did we sell, how did that compare with a similar day, and what needs explaining?
The free Excel template above gives you 31 daily rows, automatic net sales and average spend, and a comparison with the same weekday last week. It includes a blank Template tab and a completed Example tab. You can also import the .xlsx file into Google Sheets. No signup is required.
What the sales report tracks
| Field | What to enter |
|---|---|
| Date | The trading date, using the same cutoff each day |
| Food, drink and other sales | Category totals before discounts and refunds, excluding sales tax/VAT and tips |
| Discounts and refunds | Positive amounts to subtract from category sales |
| Net sales | Calculated automatically |
| Guests | People served, if you track them consistently |
| Average spend per guest | Net sales divided by guests |
| Same weekday last week | That day's net sales, entered by you |
| Change vs last week | The percentage increase or decrease |
| Notes | Anything that helps explain the result |
Yellow cells are editable. Green cells contain formulas. Enter 0 when a sales category, discount or refund has no amount; leaving a required amount empty keeps that row's result blank.
The summary shows the net sales total, completed sales days and incomplete dated rows. Resolve incomplete rows before treating the total as your month's sales. Guest count and the prior-week comparison are optional.
A completed example
These figures describe a fictional restaurant and use USD.
| Tuesday's activity | Amount |
|---|---|
| Food sales | $2,500 |
| Drink sales | $860 |
| Other sales | $0 |
| Discounts | $50 |
| Refunds | $10 |
| Net sales | $3,300 |
The calculation is $2,500 + $860 − $50 − $10 = $3,300.
With 132 guests, average spend is $25. Last Tuesday's net sales were $3,000, so sales increased by 10%. Last Tuesday also averaged $25 per guest. In this example, more guests account for the increase; higher average spending does not.
A note such as “larger dinner service” is more useful than “good day.” If the increase came from a one-off event, record it so you do not mistake that event for a repeatable trend.
How to use it at closing
- Choose the reporting cutoff. If service runs past midnight, agree which trading date gets those sales. Use the same rule every day.
- Collect category sales once. Use your POS end-of-day report, payment records or a reconciled manual tally. Avoid adding the same sale again because it appears in both the POS and card statement.
- Check the treatment of discounts. If your category totals are already net of discounts and refunds, do not deduct them again. Enter zero in those subtraction columns and note that the source was already net.
- Add guests and last week's comparison. Use people served for a guest average. If you only know transaction counts, leave guests blank rather than mixing the two measures.
- Record the explanation. Note closures, large bookings, delivery interruptions or menu availability. Carry the next action into the manager shift log.
Sales are different from cash received
This sheet measures sales performance. It does not reconcile the cash drawer, card settlement fees or the timing of delivery-platform payouts. A Tuesday sale may reach your bank later, and a platform may deduct its commission before paying you.
Keep those reconciliations alongside the sales report. Treat sales tax, VAT/GST and tips consistently when extracting net sales from your records. The template uses plain numeric amounts, so it works with USD, EUR, GBP, AUD or another currency without converting anything.
What to do with a lower-sales day
First check that the comparison is fair. A shortened shift, public holiday or private booking can make two Tuesdays very different. Then separate guest numbers from average spend. Fewer guests call for a different investigation from a lower spend per guest.
Compare your daily results with the restaurant break-even calculator. Its daily target is an average across open days, so a quiet Tuesday can be offset by a strong Saturday. Look at the month as well as the day.
Using the template with TableAI
You can keep this spreadsheet as your daily record. If manual entry becomes hard to maintain, TableAI lets you send sales and stock updates through WhatsApp and receive a morning briefing. The sales-tracking guide explains the different ways to build that habit.
The download does not import into or synchronize with TableAI. You can try TableAI during early access if messaging fits your routine better.
Common questions
Can I use this in Google Sheets?
Yes. Download the Excel file, then use File → Import → Upload in Google Sheets. Import it as a new spreadsheet so your existing records are preserved. Use the Template tab for your own entries.
How do I start another month?
Duplicate the blank Template tab and name the copy for the month. Keep the Example tab separate. The provided formulas cover 31 daily rows; if you add rows beyond that, extend the summary ranges too.
Why is the weekly percentage blank?
It stays blank when the current sales row is incomplete, the prior-week value is missing, or the prior-week value is zero or negative. A percentage comparison against zero is undefined; compare the amounts directly instead.
Can I print it?
Yes. Select the rows you need and print in landscape, fitting the columns to one page wide. Several weeks can run across multiple pages without shrinking every row onto a single sheet.